

From Skeletons to a Synthetic Population
To model how plague spread through medieval England, we want to know who lived in each settlement: how many men and women, and how old they were. No census survives from the period. We do, however, have the dead. Archaeologists have excavated and aged thousands of medieval skeletons, and we use these to rebuild the age and sex make-up of the living population.


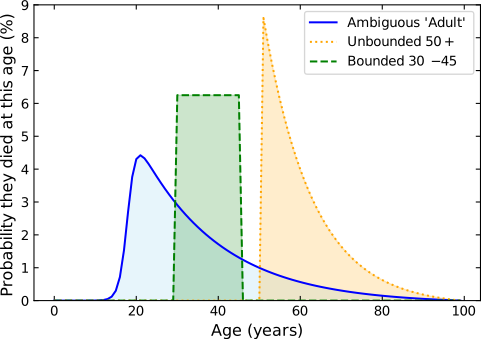
Our dataset holds 11,316 skeletons from 50 English burial sites. Specialists record each skeleton’s sex as male, female, unsexed or juvenile, and give an estimated age at death. These estimates come in many forms. Some are tight ranges such as “30-45”, some are open-ended such as “50+”, and some are just words like “Adult”, “Infant” or “Elderly”. We first translate every entry into a lower and upper age. “Infant” becomes 0 to 1 year, “Young adult” becomes 18 to 25, and “50+” becomes 50 to 100. We drop the few skeletons recorded as “Unknown” or “Unaged”.
A skeleton aged “30-45” did not die at every age in that range. It died at one age we cannot know. We therefore treat each skeleton as one unit of probability and share it across single-year age bins from 0 to 99. For a bounded range we share it evenly. For an open-ended range such as “50+”, an even share would place far too many deaths in the nineties, so we use a decaying exponential instead. It starts at the lower age, halves every sixth of the remaining span to 100, and falls to zero at 100. A bare “Adult” gets the same decay, but with a smooth one-year ramp at age 18 rather than a hard edge. Summing all skeletons gives a count of deaths at each age, for each sex. We then smooth these counts with a Gaussian of 1.5 years, which removes the spikes caused by archaeologists favouring round numbers such as 25 or 45.
Taken at face value, the sexed adults hold 4,572 men and only 2,089 women. Osteologists sex adults from the shape of the pelvis and skull, and these traits overlap. Juveniles also cannot be sexed reliably from bone, so we must share the 2,606 juvenile skeletons between the sexes.
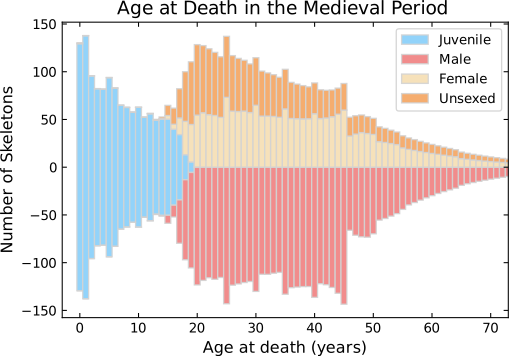
Ambiguous skeletons, which are more often female, tend to be left unsexed. Assigning the unsexed skeletons as female get close to even adult male/female numbers. We therefore count the 2,049 unsexed adults as female, which brings the two sexes close to parity.
For Juveniles, we choose the split so that, overall, 105 boys die for every 100 girls. This matches the typical human sex ratio at birth, and in a steady population everyone born must eventually die, so the totals of deaths and births agree. The fit assigns about 41% of juvenile deaths to boys and 59% to girls.
The key step turns ages at death into ages of the living. We assume that the skeletons are a fair sample of everyone who died, and that the birth rate stayed roughly steady in the decades before the Black Death. Under these assumptions, the number of people alive at age a is proportional to the number born who had not yet died by age .
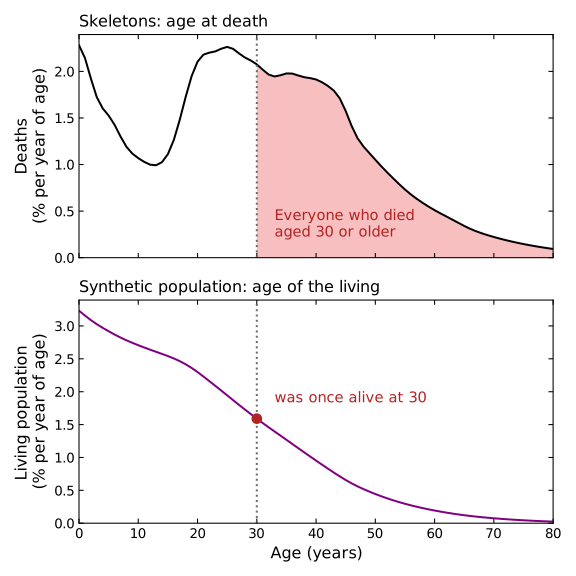
That equals the number of deaths at age or older:
Here is the smoothed count of deaths at age for sex , and is the share of the living population of that age and sex. We scale so that, across both sexes and all ages, it sums to one. The result is a population pyramid. Infants form its broad base, and it narrows quickly through childhood, when deaths were most common. From these curves the mean life expectancy at birth is about 28 years for women and 32 for men. These low figures come mostly from heavy child deaths, not from adults dying young.
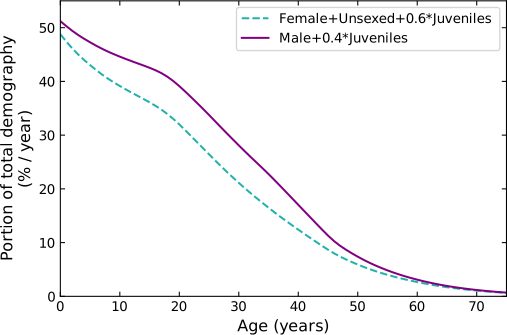
Separate historical work gives us an estimated total population for each of about 19,700 manors across England. For each manor we round this total to a whole number of people. We then draw each person at random from 200 categories, one for every pairing of sex and single year of age from 0 to 99, weighted by the demography above. Large manors closely match the national shape, while small hamlets show the chance variation of a real village. The output is a pair of tables, one for men and one for women, that give the count of people at each age in every manor. These tables become the starting population for the plague model.
