
The Code
The Code


During the COVID pandemic, it was necessary for governments across the world to make decisions about whether to restrict people’s freedoms in order to save lives and slow the spread of the disease. Predictive models of the spread of COVID were one of the best ways to see how different policy decisions would affect overall morbidity and mortality. During that tumultuous time, the original JUNE model was created.
Modelling the spread of COVID helped understand the effect of policies on the spread of the disease, and inform decision makers.
Since starting the project, we have rebuilt the JUNE code from the ground up to be a flexible tool for simulating any transmissible disease in any country, past or present.

The code creates an agent based simulation of an entire country. The idea is to use the best census data available to statistically emulate the country as best as possible. For every person, there is a virtual person. The exact activities and place of residence of these virtual people wont match the real world exactly, but it will emulate it statistically as close as possible.
As the code runs, these virtual people will go to venues (pubs, workplaces, residences, buses, etc). If an infected virtual-person is at a venue, they have a chance of spreading it to uninfected people in the same venue. By doing this thousands of times with millions of people, it paints a picture of the spread of the pathogen throughout the population as a whole. Quantitative predictions about how fast a pathogen will spread can be made, providing invaluable information for decision makers during a pandemic.
Each day is split into several time steps. This lets us build rudimentary schedules for which activities a person might do during each part of the day. For example, someone with an ordinary 9-5 job might have a simple schedule during the week:
    weekday:
      - name: "morning"
        start: "08:00"
        end: "09:00"
        allowed_activities: ["commute", "residence"]

      - name: "daytime_leisure"
        start: "09:00"
        end: "17:00"
        allowed_activities: ["work", "residence"]

      - name: "evening_commute"
        start: "17:00"
        end: "18:00"
        allowed_activities: ["commute","residence"]

      - name: "evening"
        start: "18:00"
        end: "21:00"
        allowed_activities: ["leisure", "residence"]

      - name: "night"
        start: "21:00"
        end: "08:00"
        allowed_activities: ["residence"]
and at the weekend, they’ll have a different a different schedule:
    weekend:
      - name: "morning"
        start: "08:00"
        end: "12:00"
        allowed_activities: ["leisure", "residence"]

      - name: "day"
        start: "12:00"
        end: "16:00"
        allowed_activities: ["leisure", "residence"]

      - name: "afternoon"
        start: "16:00"
        end: "18:00"
        allowed_activities: ["leisure", "residence"]

      - name: "evening"
        start: "18:00"
        end: "21:00"
        allowed_activities: ["leisure", "residence"]

      - name: "night"
        start: "21:00"
        end: "08:00"
        allowed_activities: ["residence"]
Each time step, everyone in the world is allocated to an activity at a particular venue. For example, a typical 9-5 worker will be sent to their previously-allocated workplace during the ‘day’ slot of a weekday. In the modern day, workplaces, residences, and other venues for each person’s activities are allocated based on modern census data. For the medieval world, these schedules are based on guesses from historians.
Force of Infection
Each time people gather in a venue, JUNE2 decides who catches the disease. It does this one susceptible person at a time. For each one, it adds up the risk posed by every infectious person in the room (also known as the force of infection), turns that total into a probability, and rolls a dice.

Who meets whom?
People in a venue do not all mix equally. Children in a school mostly meet other children; adults in a care home interact with staff differently from other residents. JUNE2 captures this with a contact matrix for each venue type. The matrix gives the average number of contacts a person in one age group makes with people in another age group during their time there. Each matrix also carries a transmission rate, beta, which sets how likely a single contact is to pass the disease on.
Diseases can also spread in more than one way. JUNE2 treats each transmission mode, such as respiratory, physical contact or contaminated surfaces, as its own channel, with its own contact matrix and beta. The risks from each mode simply add together.

Adding up the risk
For a susceptible person in a venue , the force of infection is
The outer sum runs over transmission modes , and the inner sum over every infectious person present. is a transmission coefficient associated with the mode of infection and the venue. , is the contact matrix mentioned above. is the number of people present in the same contact-matrix category as the infectious person j. Dividing by shares those contacts out, so each person in that group gets an equal slice. The term basically quantifies how likely it is for persons and to meet. The term measures how infectious person is via mode of transmission during the time they spend in the venue. It rises and falls through the course of their illness. Finally, is how susceptible person i is, which immunity can lower.

From risk to infection
A larger force of infection means a higher chance of catching the disease. JUNE2 converts it to a probability with
This keeps the probability between zero and one, however many infectious people are present. JUNE2 then draws a random number for the person. If the number falls below , they are infected; otherwise they leave unharmed.
When someone is infected, JUNE2 also picks who infected them and via which mode of transmission. Each infectious person’s chance of being chosen matches their share of the total risk, so a person who was more infectious, or who had more contact, is more likely to be named. This gives a full record of who infected whom, and where.

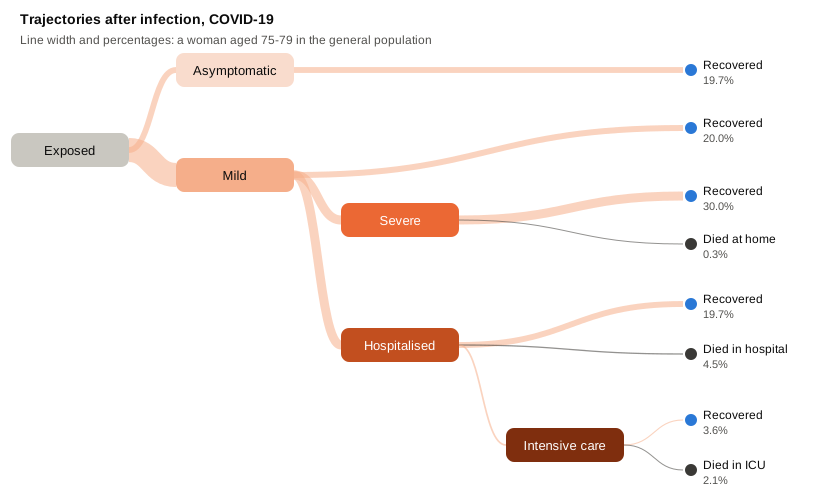
Once someone catches the disease, JUNE2 decides how their illness will unfold. It picks a path, called a trajectory, at the moment of infection. The trajectory sets which symptoms the person will have, how long each lasts, and whether they recover or die.
Choosing a path
How the illness goes depends a lot on who caught it. An infected child will most likely have no symptoms or a mild illness, while an older person faces a much higher chance of hospital or death. JUNE2 holds a table of outcome probabilities sorted by age, sex and population type, so care home residents, for example, can have their own rates. For COVID-19 the outcomes run from asymptomatic and mild, through severe illness at home, hospital and intensive care, to death at home, in hospital or in ICU.

For a person with outcome probabilities , JUNE2 picks outcome with
One random draw settles it. Vaccination or prior exposure to the infection can shift some of this probability away from the more serious outcomes and onto milder ones.
Stages and their lengths
Each outcome links to a trajectory, which is a chain of symptom stages. A COVID-19 hospital case, for instance, runs exposed, mild, hospitalised, mild, then recovered. Every stage has a random duration, drawn from its own distribution when the person is infected.

If stage begins at time , the next begins at
where might be a fixed value, or a beta, gamma or lognormal distribution. Two people on the same trajectory therefore move through it at different speeds. The person’s whole illness is fixed from the start, but they only reach each stage as the simulation clock catches up, and their symptoms then shape what they do, such as staying home or going to hospital.
Infectiousness over time
JUNE2 offers two ways to set how infectious a person is over time. Both are valid, and the choice depends on the disease.
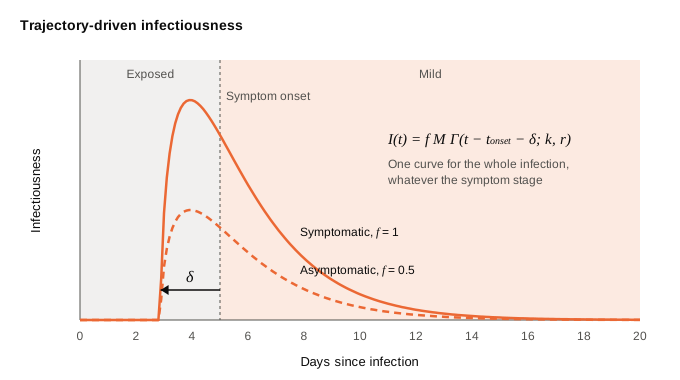
In the time-driven approach, one curve covers the whole infection. For example, infectiousness can follow a gamma-shaped profile, measured from symptom onset:
Here sets the peak height, and set the shape and spread of the curve, and shifts it in time. A negative shift lets people pass the disease on before they feel ill, as with COVID-19. JUNE2 draws and for each new infection, so no two people are quite alike. The factor belongs to the trajectory, letting asymptomatic cases, for example, spread half as much as the rest.
In the stage-driven approach, each symptom stage has its own curve, and the clock restarts when the person enters it:
where is the person’s current stage and the time they entered it. A stage can be flat, ramp up, decay away or follow a gamma curve. This suits diseases whose spread, in particular the mode of infection, changes as the illness moves on, such as plague turning from bubonic to secondary pneumonic – unlocking the respiratory mode of transmission. Either way, feeds straight into the force of infection, linking each person’s illness to the risk they pose to others.

People rarely catch a disease from strangers alone. Much of the spread runs along ties people already have: friends, workmates, neighbours and partners. JUNE2 reads these ties from the World, where MAY builds them before any simulation runs.