


Counting People
We need to estimate how many people lived in each ville. To estimate this, the best source we have pre-1348 is the Lay Subsidies. However, the relationship between Lay Subsidy value and the number of people in a settlement is not obvious.

What are the Lay Subsidies?
The Lay Subsidies were a tax on the wealth of a nation.
For a subset of settlements (8094 out of ~20,000) covering 27 of the 40 counties, we have both the Lay Subsidy value and the number of taxpayers. For the other settlements we only have the Lay Subsidy value. We need a way to estimate the number of taxpayers from the lay subsidy value.
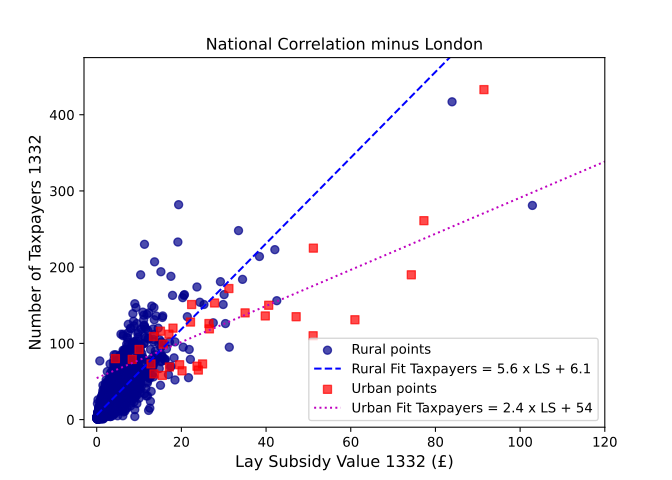
We can see at a national level a clear linear correlation between the Lay Subsidy value (LS) and the number of taxpayers. The steepness of this correlation (i.e. the number of taxpayers contributing towards each £ of LS) depends on if the settlement is urban or not. For settlements where we know the number of taxpayers, we can use that number to then estimate a total population. For the numerous settlements for which we only have the LS value, we can use the gradient between taxpayers and LS to estimate how many taxpayers there are.
For each county we have data (27) we can find the linear fit of taxpayers to LS for that particular county. Essentially we are estimating the local tax policy and economic conditions, which differs from county to county.

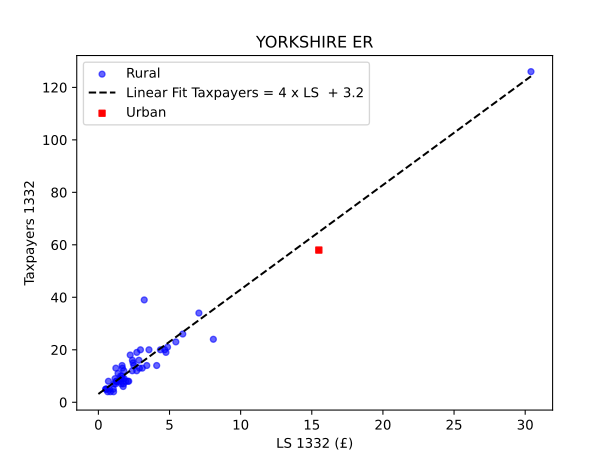
For some counties there will still be anomalies – for example Urban settlements – where it just might not be obvious how they should be assigned. However, this method at least gives us a starting point which can always be refined on a case-by-case basis later.

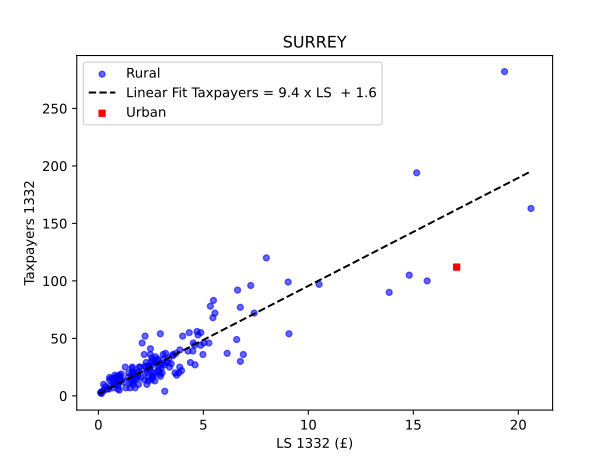
There is clearly a variety of tax gradients and intercepts, indicating that it is worthwhile using the local county estimate whenever possible.

We can clearly see large variation between the counties in the fits. When looking at the gradients of each fit, we can see some counties such as Surrey have a far higher gradient between Lay Subsidy value (LS) and taxpayer number than others.
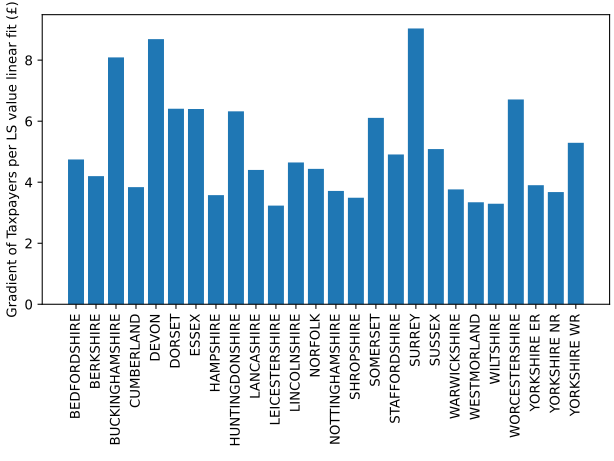
Another graph showing similar variability is the number of taxpayers contributing towards each £ of Lay Subsidy. With places like Yorkshire ER, Leicestershire, and Berkshire having nearly half as many taxpayers working towards each £ of LS compared to Dorset or Somerset. Devon sticks out as a particular anomaly with an incredibly large number of taxpayers per LS (i.e. a small LS burden on each taxpayer). This shows large variability in the tax burden and wealth of counties.

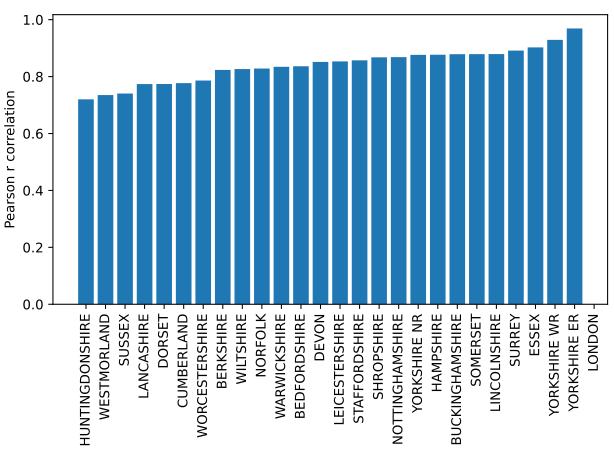
One measure of how strong the correlation between Taxpayer number and LS is the Pearson r correlation. Person r measures linear correlation between two datasets by computing the ratio between the covariance of the two variables (or how much one varies when the other varies) and their individual standard deviations. The key concept is that a value close to 1 means that the linear correlation is strong compared to the randomness of the data. As can be seen, we have a good Pearson r value for all the counties we have data for.
At the moment, the best hope is to use either a nearby estimate, or the national gradient.